
Rates were already high coming into this week. As of last Friday, that meant an average 30yr fixed rate just under 7.5%. As of this Friday, we're closer to 8%.
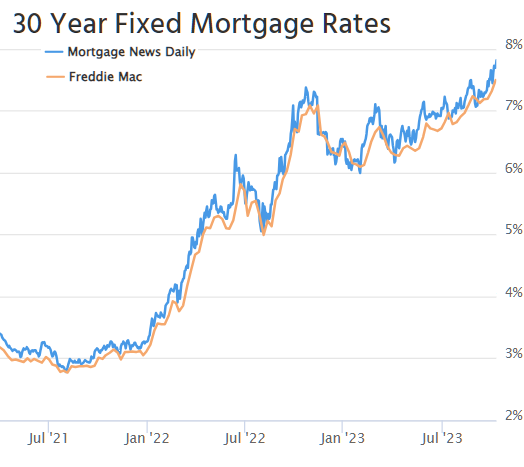
Certain lenders may be quoting lower rates, but that often involves the presence of discount points. The Freddie Mac survey (orange line above) doesn't account for discount points. It's also a weekly average and has not yet counted the rates seen on Thursday or Friday.
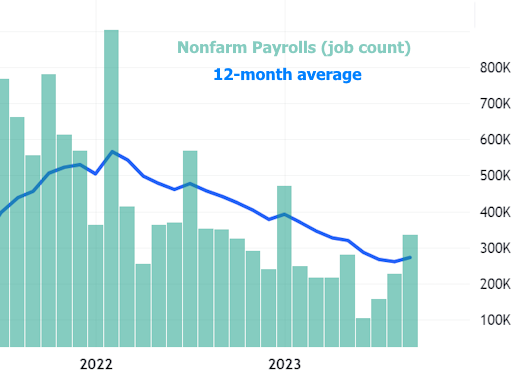
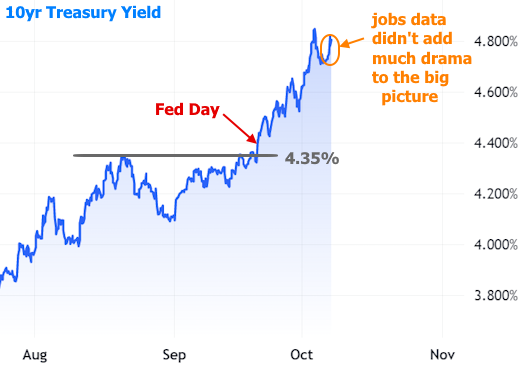
Friday brought a sharp rise to the highest levels in 23 years. The most obvious culprit was the big monthly jobs report which showed job creation (nonfarm payrolls) increasing far faster than economists predicted. It was one of only a handful of months in the past few years that came in higher than the 12 month trailing average.
Perhaps just as importantly, this is a level of job growth (336k) that falls at the upper edge of the pre-pandemic range.
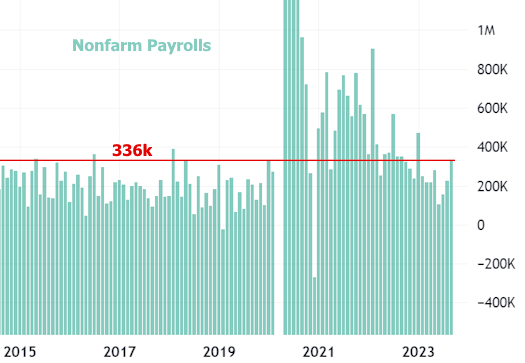
Most economists thought we wouldn't be breaking back above 300k after averaging less than 200k for the past 3 months. In a world where the Fed constantly reiterates "data dependence," this was a blow for rates. 10yr Treasury yields--the most ubiquitous long-term rate benchmark--left no doubts as to the bond market's response.
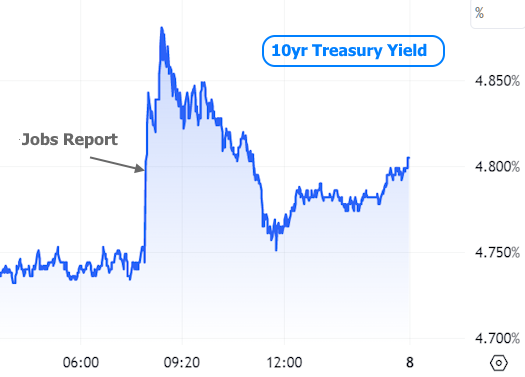
It's easy enough to see the vertical line after the jobs data, but what's up with the fairly big recovery later in the day? If bonds are freaked out about data, why would they erase a majority of the losses?
There are a few reasons. The best one is actually the most esoteric as it has to do with the tendency for traders to close out trading positions on Fridays and especially on the Fridays before 3-day weekends. If traders were betting on higher rates (and they were!), the closing of those positions would bring rates back down a bit.
Ultimately, that position closing doesn't really change the bigger picture. In fact, the jobs report reaction barely sticks out on a longer term chart. What DOES stick out is the shift in momentum that began after the last Fed day--the one we've discussed a few times now as the market's way of repricing toward a "higher for longer" rate trajectory.
It continues to be the case that economic data needs to be substantially more downbeat on a consistent basis (2-3 months) in order for the Fed to acknowledge that a true shift is taking place and that the end of their "higher for longer" policy stance is up for discussion. Only then would rates have a chance to meaningfully decline.
Still, there's lots of hope out there that rates could/should decline for other reasons. One observation that's become quite popular is the wide spread between mortgage rates and 10yr Treasury yields. For some reason, people think if spreads could only be a bit more narrow, mortgage rates could be more tolerable without the need for any major change in the broader bond market.
The following chart shows mortgage rates and 10yr yields on the same axis. It's hard to track spreads with a chart like this, but it's easy to see why the 10yr is used as a benchmark for mortgages!

The next chart makes the change in spreads easier to track. It is quite simply the value of the blue line above minus the value of the orange line. It shows that people might not be too crazy to hope for a return to a more normal spread range. After all, if we're near 3% right now, a move down to 2% would put the average mortgage lender back in the high 6% range for a 30yr fixed.

A 2% spread is probably something that can be reasonably entertained, but some pundits are talking about spreads in the 1 to 1.5% range. A tightening of that magnitude is highly unlikely in the short term and possibly even "ever." To talk about why, we first need a quick refresher on the Fed's role in the mortgage market.
In order to prevent more catastrophic outcomes from the Great Financial Crisis, the Fed began buying large amounts of mortgage-backed securities (MBS) in 2009. In conjunction with the Fannie/Freddie conservatorship, this calmed investors and brought spreads down (mortgage buyers demand higher yields/rates when mortgage debt is perceived as more risky, thus inflating spreads).
Over the next decade, the Fed would not be able to stop buying MBS for long without spreads blowing out. Notably, there was only about a year of time before covid that the Fed was actually decreasing the amount of MBS it owned. That year coincided with broadly lower rates due to the trade war, and a lower rate trend helps spreads stay more narrow than they otherwise would be.
Why can't we use the time before the financial crisis as a spread baseline? We can, to some extent, but nothing before the housing reforms of the mid 90s which expanded accessibility to mortgage financing and made the landscape riskier for investors. There is a very obvious bump in spreads at that time, and that marks the only real baseline that matters. Here's the same chart, but with that time frame highlighted.

Since covid, we've had two instances of panic. The first was addressed with the most massive glut of Fed bond buying in the history of Fed bond buying. It crushed spreads and set us up for the world of pain we're in now. As the Fed once again began shrinking its mortgage holdings in 2022, spreads blew out again. Combined with the surge higher in benchmark rates and the overall volatility (both things that hurt mortgage spreads) we saw even higher levels at the end of 2022.
But now, miraculously, without any Fed intervention, spreads have been grinding to slightly narrower levels. Sure, they're still very wide, historically, but the Fed will definitely not be riding to the rescue this time around. Moreover, policymakers won't likely be concerned enough to do anything about it until and unless a broader interest rate correction fails to help mortgage rate spreads come in a bit. Fortunately, a broader interest rate correction will almost certainly do just that. Just don't expect it to restore the 1.0-1.5% spread level any time soon.
Think of it more like this: if 10yr yields find a scenario where they can rally down to 3.5% and spreads can return to 2.0%, that puts a 30yr fixed mortgage rate at 5.5%. At that level, the conversations about the weird things that need to happen to save the mortgage market would be very different, or altogether unnecessary.
