A majority of the housing market data on any given month tends to come out mostly on the same week. This was that week and the takeaway was that the housing market could be doing worse. Some might even argue that we're seeing some resilience relative to the rate landscape.
Let's refresh our understanding of the rate landscape first. The bond market (which drives interest rate movement) has been broadly sideways recently as investors wait to see how quickly inflation (bonds' biggest concern) is subsiding. That "wait and see" approach prompted the Fed to hold its policy rate steady at last week's meeting, but that was widely expected by the bond market and thus not worth much of a reaction.
Fed Chair Powell gave his regularly-scheduled congressional testimonies this week and had a chance to talk a bit more about where the Fed sees things going from here. We already knew the average Fed member saw about 2 more rate hikes before achieving a terminal "ceiling" level, assuming the economy evolved as expected, but Powell was able to clarify what "as expected" meant.
Interestingly enough, the additional hikes are not seen happening in response to some additional upward momentum in inflation or economic growth. Rather, the Fed's baseline expectations call for continued cooling in the labor market, modest economic growth, and continued cooling in inflation. In other words, inflation and the economy have a very low bar to justify a few more rate hikes. Things would have to deteriorate pretty abruptly for the Fed to abstain. Moreover, if things improve a bit better than expected, we could be looking at more than 2 additional hikes.
The problem with these expectations and the actions predicated upon them is the elevated uncertainty about the outlook. Economic uncertainty is often reflected in sideways trading ranges in the bond market. Using 10yr Treasury yields as a proxy for other rates (like mortgages), we see clear sideways ranges in the short term.
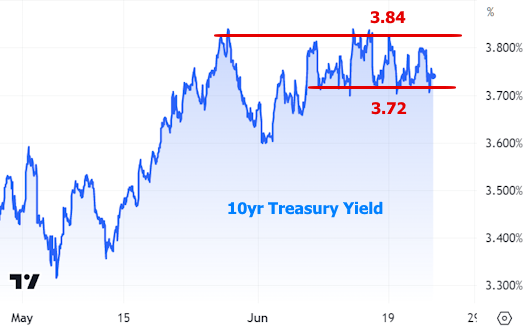
And in the long term.

The longer term chart also serves as the best recap of the rate landscape. Specifically: rates are high--not as high as they were in late 2022 or even earlier this year, but certainly much closer to the higher end of the range over the past few years.

The rate surge in 2022 had predictable consequences for the housing market, but even though rates remain high, volatility has died down.

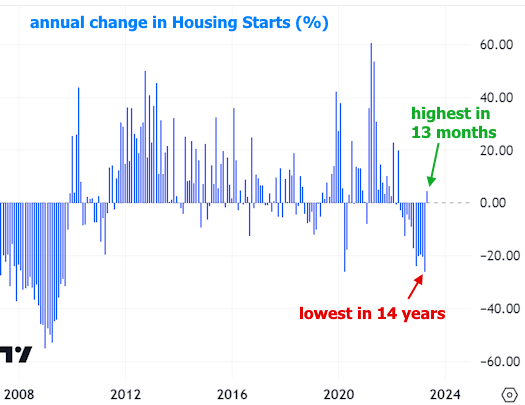
Lower rate volatility has helped housing find bottom. Essentially every housing report that came out this week told a different version of that same story. Some reports were downright upbeat, such as the surge in "housing starts" (a term that refers to the ground-breaking phase of new construction). Only 10 months have been higher in more than a decade.

This also marked a major reversal in the trend for new construction. Last month's report showed the worst year-over-year growth in 14 years while the new report showed the best growth in more than a year--a shift of more than 20%.
This is a notoriously volatile set of data, but swings like this still send analysts looking for explanations. One of the most commonly cited mitigating factors is the larger and more stable role being played by multi-unit construction. Multi-family starts are right in line with their highest levels in more than 3 decades, and they were essentially unaffected by the 2022 rate spike.

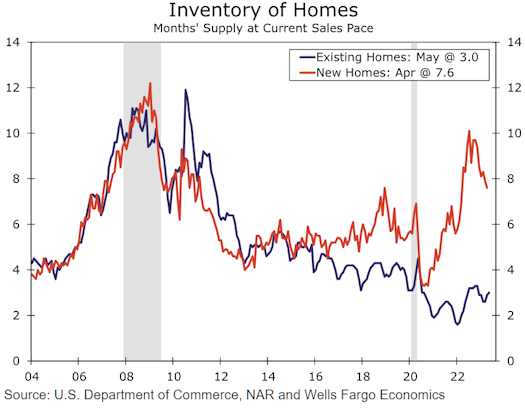
The other "yeah but" is that the new home market is quite a bit smaller than the existing home market, and the latter is better described as "treading water," even though the most recent number came out slightly higher than last month.

The "yeah but" to that "yeah but" is that inventory is holding the market back.
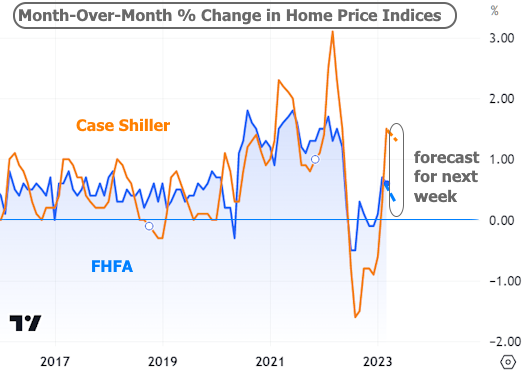
There are a few more of the big monthly housing reports yet to come in the week ahead. Most arrive next Tuesday morning with New Home Sales expected to stay fairly flat at an annual pace of 670k and the duo of home price indices from FHFA and Case-Shiller (both expected to show slower, near-zero price growth). Thursday's Pending Home Sales index is expected to show 0.2% growth after holding steady last month.