Scroll down far enough on the list of Webster's definitions of the word "consolidate," and you'll find "to form together into a compact mass." Financial markets appropriated that definition long ago and have been using it to refer to the condensed mass of prices, yields, or whatever else is being measured on a chart.
Speaking of charts, consolidation has a tell-tale pattern of lower highs and higher lows that form a sort of triangle or pennant (incidentally, market participants also use those terms more or less interchangeably).
Regardless of the label, the underlying phenomenon is one of indecision or anticipation of a big move that has a chance to be higher or lower.

Consolidation is everywhere in the market these days. If we zoom way out and simply consider the general flow of events, this makes good sense. As inflation surged at the fastest pace in decades, the Fed tightened monetary policy at a similarly fast pace. Inflation can also act as a natural brake on economic activity as consumer buying power declines.
At some point, the inflationary surge levels off and we wait for price growth to moderate back toward more sustainable levels. The presence of consolidation makes sense because we're smack dab in the middle of finding out whether inflation has leveled off as a sign that it's about to go lower, or simply to take a breath before remaining stubbornly high. Consolidation patterns are equally likely to be seen for both reasons.
This week's focal point for economic data and the broader consolidation theme was Wednesday's release of April's Consumer Price Index (CPI). More than any other inflation report, CPI has had the power to push rates rapidly higher or lower.
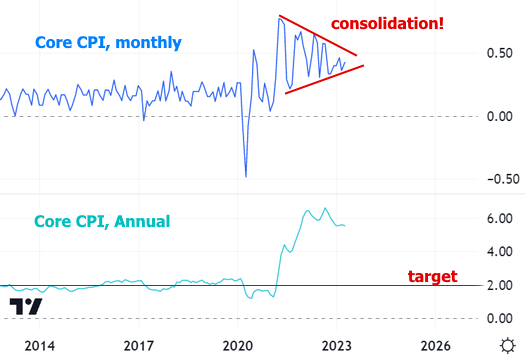
CPI was right in line with expectations this time around, which doesn't really help clear up much indecision. The monthly change of 0.4% at the core level (the one that gets the most attention from the Fed and financial markets) is right in the middle of consolidation pattern. And the annual number remains fairly flat after coming off the higher levels seen at the end of 2022.
There were some subtleties underneath the headlines that were helpful for rates. Specifically, there was a nice little drop in core services inflation excluding housing. This is a hot button for the Fed, as it captures a vast majority of the inflation that has been the most problematic. Removing housing from the equation allows the market to see a shift earlier than it otherwise might (because the housing components don't move as much or as quickly).
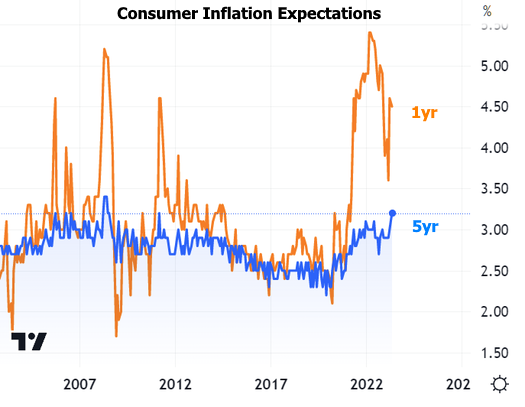
All that to say: interest rates moved lower on Wednesday despite CPI coming in flat. The following day, Jobless Claims and the Producer Price Index (PPI) helped the move continue, although bank sector drama was also driving investors into US Treasuries. Yields bounced on Friday after the Consumer Sentiment survey showed 5-year inflation expectations at their highest level since 2011.

The chart of 10yr Treasury yields above is a good proxy for interest rate momentum throughout the week. It may not look like a good example of consolidation on such a short time scale, but if we zoom out, things change.

And what would a good proxy for rate momentum be if its sideways vibes didn't translate to the mortgage market?

In fact, as of Friday, mortgage rates clocked their flattest calendar month since May 9th through June 9th, 2022.
The point of all this consolidation observation is simply to convey that the market is at a crossroads--albeit with a very long stop light--that will inform the next big move for rates and the housing market.
If inflation moves lower out of its consolidation pattern, rates would almost certainly do the same, thus allowing homeowners some breathing room to shop for new homes without worrying about sacrificing their ultra low existing rate.
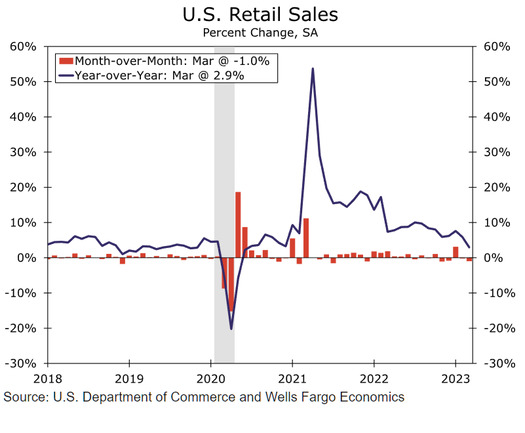
In the week ahead, we'll get to see how that process is going via the Existing Home Sales data on Thursday. Two days prior, the Retail Sales report will provide an update on consumer spending. In general, lower sales suggest downward pressure on inflation, but economists expect a +0.7% increase this time around compared to a 0.6% decrease in the last report.