(Most of this newsletter lays out a counterpoint to the fairly dominant theme of "higher rates in 2018." Please note: this is just the bright side of the debate. There's still a dark side, but we're giving it the week off for Spring Break!)
It's no secret that late 2017 and early 2018 were anything but pleasant for fans of low rates. Average mortgage rates and Treasury yields shot higher at their fastest pace since the 2016 presidential election. Even after that spike, there are still plenty of reasons to fear rates may continue higher, and that's exactly why they could go lower.
The emphasis is very much on "could." At the risk of bursting any bubbles, rates "could" always move higher or lower from wherever they are right now, and traders are constantly trying to adjust today's rates to reflect future probabilities. In other words, whatever can be accurately known about the future is generally already priced-in to current rate levels. This is actually the foundation of our rate-friendly narrative this week, but first, let's recap the data and market movement.
Housing-Related Data Recap
The National Association of Realtors reported a 3.1% improvement in Pending Home Sales, a measurement of home purchase contract activity. This follows a 5% decline in the previous month and helps to contain the year-over-year declines seen in the lower section of the following chart.

The Mortgage Bankers Association released its weekly update on mortgage applications, which showed another nice gain for purchases and a token improvement for refis. The good news is that we haven't even hit peak season for purchase apps (June). When we do, the numbers should be even better.

Persistent homebuying demand + low inventory = higher and higher prices. The Case-Shiller price index echoed other recent home price reports with a move up to 6.4% for January--not quite as high as FHFA's January numbers, but 0.2% higher than was forecast for this report. Moreover, in seasonally-adjusted terms, this week's "20-city price index" hit new record highs.

Market Movements and Rate Outlook
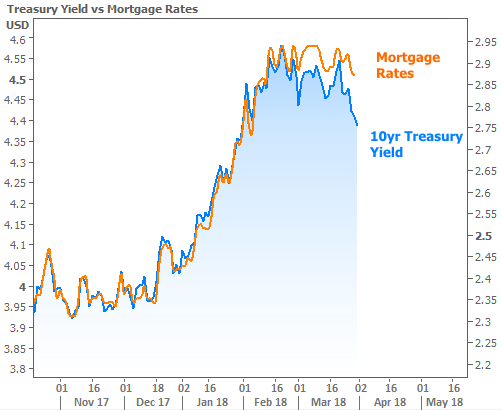
Rates dropped at their fastest pace of the year* this week, and for the 3rd week in a row! That makes 6 out of the past 7 weeks with rates closing at lower levels than the previous week. Granted, some of those victories involved rates essentially remaining flat, but after the rapid spike earlier in the year, we'll take any victory we can get!

Because financial news outlets are decidedly stock-focused, much of the available commentary on rates ends up involving stocks. The conventional wisdom seems to be that heavy losses in stocks get credit for noticeable declines in rates. There is SOME truth to this, but the correlation is far from guaranteed.

In fact, the biggest moves tend to happen when rates are doing their own thing. For instance, in the chart below, the big drop at the beginning of 2015 was due to the onset of the European Central Bank's bond buying program (more bond-buying = lower rates). The big spike in late 2016 was due to bond traders fearing increased Treasury issuance (more supply = more to sell = higher rates) after the election. And if all that isn't enough to hammer home the fact that stock/rate correlation varies quite a bit, just use the lower pane of the chart to re-calibrate your assumptions as needed.

Since the previous chart offered 2 good examples of bonds/rates doing their own thing regardless of the stock market, what might turn out to be the current motivation for the next big move? Interestingly enough, stocks could actually play a pretty big role this time. The higher they've gone, and the longer they've gone without a bear market, the greater the fear of a massive correction. Most analysts would agree that February and March would end up looking like a small warning shot relative to such a correction. To whatever extent that drama begins to unfold, rates couldn't help but improve simply because so much money from the stock market would be seeking safe havens.

Were I to argue against the "safe haven" idea, I would point out that the current environment is not conducive to rates moving lower for two, maybe three big reasons:
1. Fed rate hike expectations suggest short-term rates will be high enough in the future that long-term rates (the stuff we care about in the mortgage/housing market) will have to go somewhat higher.
2. Increased government bond issuance (to pay for stuff like infrastructure and the tax bill) will create more and more supply. Higher bond market supply = higher rates.
3. Fiscal policies may promote additional economic growth and inflation--both of which are traditionally bad for rates.
All of the above points are valid, but there's one important counterpoint back on the optimistic side of the rate argument, and it goes back to the beginning of the newsletter: "whatever can be accurately known about the future is generally already priced-in to current rate levels."
With that in mind, anything that impacts the accuracy of the outlook creates opportunities for rates to do "something different." Uncertainty about the true cost of the tax bill over time means uncertainty about how much debt will be issued to pay for it. If the tax bill actually ramps up revenues as much as some of its proponents think it might, bond markets likely overestimated the government's future borrowing needs. And again, anything that decreases those borrowing needs is a net-benefit for rates.
Bottom line: adjusting for the effects of the tax bill presented a moving target for bond markets. At the same time, traders were also adjusting to a slightly accelerated Fed rate hike outlook. The juxtaposition of these 2 themes advocated caution among traders. Because of that, it made more sense to push rates higher first and ask questions later.
Now, those questions might be starting to get asked. Did we assume a worst-case scenario for Treasury issuance without planning on much relief from revenues? Is the Fed really going to end up hiking as fast as their forecasts indicate? With the tax bill effects already priced in, any rethinking of Fed rate hike expectations is more free to have a positive effect on today's longer-term rates. We may already be seeing signs that the trajectory is leveling off (lower pane of the following chart).

*One final caveat for mortgage rates specifically. This one is a blessing and a curse. On the one hand, mortgage rates have been much less volatile than Treasury yields recently. On the other hand, keep in mind that mortgages don't tend to benefit as quickly when bond markets are improving overall. If Treasury yields continue lower, mortgages will eventually follow, but it will take time, and the gains will need to stabilize for weeks before lenders begin to close the gap.