
The Fed released a new scheduled policy announcement this week as well as updated economic projections. Relative chaos ensued. Let's talk about why and what it means going forward.
Background on Fed Funds Rate and Mortgage Rates
There's a fairly prevalent misconception that the Fed sets/changes mortgage rates directly. That's really only true for HELOCs (home equity lines of credit, which are often based on a rate that's based on the Fed Funds Rate).
The Fed does not set/change mortgage rates, even though things that happen on "Fed Day" can have a big impact. The rate the Fed changes is the Fed Funds Rate, which is a target that big banks use in determining the rates they charge each other for overnight loans.
This rate is important. Even though banks have lots of money, depending on the day's operations, they may need an overnight loan to meet demands on their cash. Some banks have more than enough cash for the day's operations and are thus able to lend that money to the other banks who need cash to balance the day's books.
The Fed Funds Rate thus becomes a key input for the flow of money. It also becomes the anchor for all longer term rates. Those rates can vary quite a bit as the time frames get longer. For instance, the yield (another word for "rate") on 30yr Treasury bonds can be vastly different from the Fed Funds Rate. Conversely, 2yr Treasury note yields are usually much closer to the Fed Funds rate because "2 years" is much closer to "overnight."
This spectrum of different rates for different periods of time is known as the yield curve, and it looks like this right now:

The yield curve is very flat up to the 1yr mark because no one expects the Fed to even consider hiking the Fed Funds Rate before then. Rates are higher for longer time frames because investors generally expect higher returns if they're loaning their money for longer periods of time. There are also many other considerations that go into setting longer-term rates, especially mortgage rates. The Fed Funds Rate simply provides a starting point for those other considerations, which is why we see correlation in the biggest of pictures:

But for all practical purposes, that correlation is irrelevant over the few weeks/months that someone is typically in the market for a mortgage rate.

Still, a quick change in Fed Funds Rate expectations can reverberate through the yield curve, and that's what we saw this week.
So What Exactly Happened This Week?
In short, the Fed released updated economic projections, which allow each member to forecast Fed Funds Rate levels in coming years. By the Fed's own admission, this is a highly imperfect tool and one that almost always misses the mark significantly. Nonetheless, markets tend to react to the "dots" (a reference to the dot plot on which the rate forecasts are presented).
The new installment of the dots shows the median Fed member now thinks the Fed Funds Rate will be 0.5% higher by the end of 2023 than they did in the last set of forecasts (in March). Remember, the Fed's rate has more of a bearing on shorter-term rates with diminishing returns for longer time frames. With that in mind, here's what happened in 2yr Treasury yields versus 10yr Treasuries.
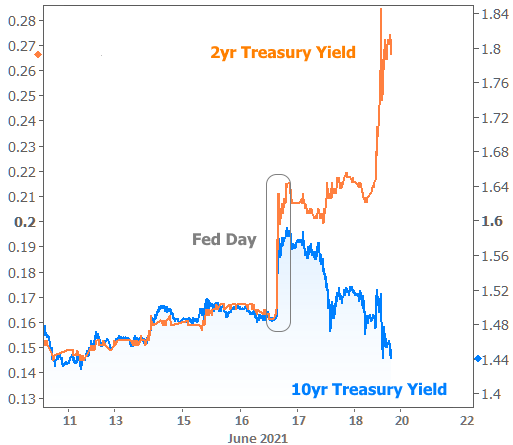
In other words, although longer-term rates had a token reaction to the dots, it was truly all about the implications for the short end of the yield curve. That's why 10yr yields were able to move back down by the end of the week while 2yr yields continued to panic.
The average 30yr fixed mortgage tends to last between 5 and 10 years. It's only something that can be estimated at the time a mortgage bond is created, but in any event, 10yrs would be very high for such estimates. As such, mortgage rates didn't recover as well as 10yr Treasury yields (because, again, the longer-lasting bonds did better after the Fed).
The mortgage market is also concerned over recent Fed comments about its bond buying programs (the Fed currently buys 2 main types of bonds: US Treasuries and Mortgage-Backed Securities or MBS). Some Fed speakers have suggested that, when it comes time to decrease their bond buying, they may chop the throttle on MBS more quickly than on Treasuries. Lower buying demand from the Fed means MBS prices would fall and rates would rise.
All told, mortgage rates jumped fairly quickly to the highest levels in 2 months--a fact that lies in stark contrast to many of this week's mortgage rate articles. Those articles invariably cite Freddie Mac's weekly rate survey (which is occasionally and unintentionally misleading). This should clear things up.
What's Next?
Longer-term rates have shown a tremendous amount of resilience in a year that could have easily seen them move much higher. The year is not over though. The resilience could merely exist inside the "intermission" that we've discussed in previous newsletters. Nothing has been written in stone yet. Rates could indeed move higher by the end of the year if the economic data evolves in a way to justify that.
Between now and then, markets will do their best to get inside the Fed's head. Nonfarm Payrolls (via the big jobs report) in early July and various inflation-related reports will provide key opportunities to do that. Volatility can spike for other reasons, but unless the economy completely falters or surges, it's hard to make a case for an extreme move in either direction at this point. Volatility is more likely to play out within the confines of a broader rate range.
