
The housing market is heating and cooling at the same time, depending on the data in question. Who's telling the truth? Actually, maybe everyone...
According to home price appreciation, the market is on fire. FHFA and Case Shiller (2 of the main home price reports we follow--both updated this week) differ slightly in their historical measurements, but both are in agreement that year-over-year price gains are as high as they've been in a LONG time (record highs for FHFA).

Things are moving in the other direction for home sales. This week's Pending Home Sales release showed a decline of more than 10% (back to pre-pandemic levels).

So who's lying? Is the housing market hot due to surging prices or is it cooling off based on declining sales?
The two can actually coexist due to INVENTORY, or lack thereof. In addition to the obvious limitations it places on home sales, tight inventory can also force prices up as more buyers compete for fewer properties. It's never been tighter than it is right now.

The inventory situation may mean that prices remain more resilient in the current housing cycle despite the recent surge in interest rates (something we can't stop talking about). Even then, past examples of rate spikes have only had moderate impacts on housing. Using the same home sales data from above, let's highlight previous rate spikes so we can see the impact...

... and prices (this is the same FHFA home price data, but the chart is zoomed in to show more granular detail).

There was a big rate spike at the end of 2016 that had no discernible effect on prices. This is notable because that rate spike was fueled by economic optimism as opposed to 2013's rate spike which happened after the Fed said they would begin decreasing their rate-friendly bond buying program. 2018 was somewhat similar as the Fed was continuing to tighten monetary policy and raise short term interest rates.
A case could be made that the current rate spike shares some similarities with 2016. The path of 10yr Treasury yields (a benchmark for longer term rates like mortgages) has largely traced pandemic progress and economic recovery hopes. Yields (aka rates) began rising late last summer as vaccine trials showed promising results and economic data began to improve.
Rates spiked more quickly in the new year as vaccine logistics ramped up and covid-relief legislation was passed. Fiscal spending hurts rates both due to both its positive implications for the economy (a stronger economy supports higher rates) and the implication of more US Treasury issuance (more Treasury supply = lower bond prices = higher bond yields = higher rates).

We've devoted many previous newsletters to discussing the disconnect between mortgage rates and Treasury yields. The connection is largely re-established and it once again makes sense to consider Treasury trends as the best early indication of potential shifts in momentum. With that in mind, the current zone of 1.6 to 1.75 in 10yr Treasury yields is important. There have been two solid bounces at or near 1.75, but not enough of a recovery to guarantee a momentum shift.

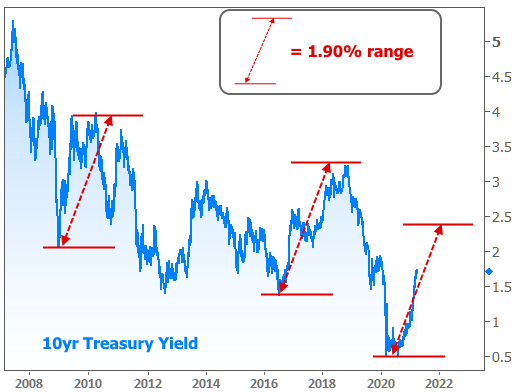
If 1.75% is decisively broken and the unfriendly trend remains intact, it would contribute to the "red" scenario below. The green scenario is also a possibility, but it would take some unforeseen shock (something like a new covid variant that doesn't respond to vaccines or the rapid realization of a weaker post-covid economy).

Is it realistic for the red line to be all the way up around 2.4%? History suggests it's very much in the playbook. Each overlay is exactly the same size and covers exactly 1.9%.
Where would mortgage rates be if 10yr yields rose to 2.4%? A safe bet would be to assume at least 4.00% for a 30yr fixed based on the typical distance between the two over time.

And what about the rapid realization of some negative economic shock? Things can always change in the future, but if this week's economic data is any indication, negative shocks would be a tall order. here are a few highlights:
Consumer Confidence surged well above its previous post-covid highs.

The most widely-followed measurement of the manufacturing sector (ISM Purchasing Managers Index) hit its best levels since 1983!

And the big jobs report was strong on several levels. Even though there are still 9 million jobs missing from pre-covid levels, the economy added close to a million last month.

The average work week increased to 34.9 hours. That might not sound like a lot to those working full time, but before covid, it never went higher than 34.6. Those .3 extra hours equate to more than a million additional jobs that could come back into the labor force right now.

Bottom line, it is a rising rate environment until further notice. If we don't see a negative turn of events for the economy, rates will eventually run out of steam for other reasons. But that could take time, and the overall rate spike could rival the worst past examples by the time it fully runs its course.
The upcoming week is light in terms of scheduled data and events, but it provides an important opportunity for rate watchers to observe the underlying momentum in the bond market. A strong defense of the 1.75% ceiling in 10yr yields would go a long way toward suggesting a period of consolidation for rates (as opposed to a relentless move higher).
