
There's no precedent for the winning streak enjoyed by mortgage rates in the 2nd half of 2020. We've never seen so many new record lows in the same year, and we never spent as much time at those lows (not even close). All of the above makes it easy to get lulled into a false sense of low-rate security, but it's time to wake up.
Actually, the alarm has been going off for a while now. Previous newsletters pointed out the disconnect between the bond market and mortgage rates on multiple occasions in 2020. Near the end of the year, we warned against complacency in no unspecific terms.
Following the Georgia senate election, we've been tracking a surge in bond market volatility based on the expectation that it would increasingly spill over to the mortgage rate world.
(Read More: 1/8/21: Have We Seen The End of Record Low Rates?)
As of this week, that spillover arrived in grand fashion with many lenders quoting rates that are as much as three eighths of a point higher than they were last week. That means if you were looking at something in the 2.75% neighborhood on Friday, it could be 3.125% today. What gives?
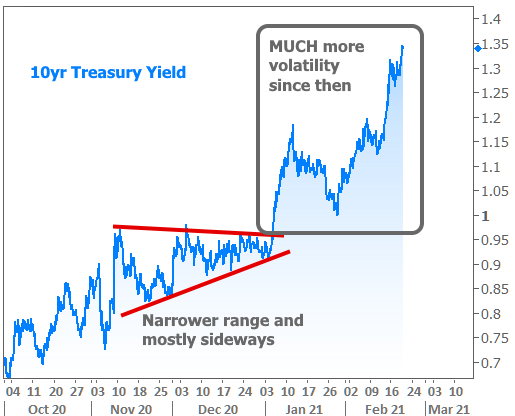
Again, the upward pressure is nothing new. Treasury yields have been telling the story since August and mortgage rates have finally used up enough of their cushion that they've been forced to follow the broader trends.

Why have things been so abrupt? Using up "the cushion" is one thing, but that alone doesn't force rates to go higher. For that, we need "broader bond market volatility." In other words, Treasury yields need to be spiking.
As it turns out, that's been one of their favorite things to do in 2021. If it seems abrupt, that has a lot to do with bonds coiling in a conservative pattern heading into the Georgia senate election, and unleashing chaos thereafter.
The election is old news now though. It simply got the ball of volatility rolling. Most recently, plummeting covid case counts, improved vaccine distribution, stronger economic reports, and progress on fiscal stimulus reinvigorated the volatility. This week, 10yr yields broke up and out of their prevailing "trend channel" (the parallel lines seen below).
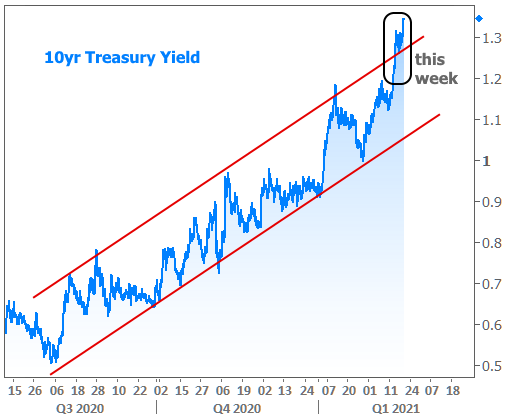
There's no magic rule that says Treasuries have to stay inside those red lines, but this sort of breakout can be a cue for traders to intensify selling pressure. In other words, that upper line was a trigger for yields to move even higher.
"But wait... I thought the Fed said it was keeping rates low for YEARS. What happened to that?"
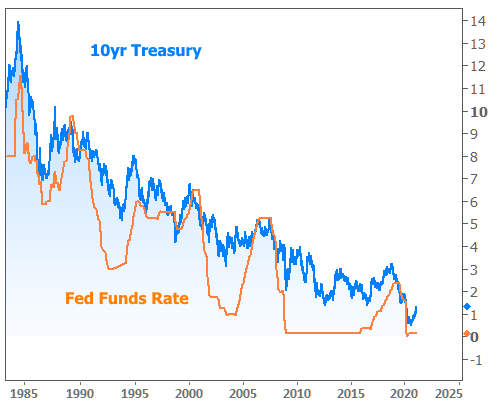
The Fed sets the Fed Funds Rates... NOT mortgage rates. The Fed Funds Rate is a super short-term rate ("overnight," in fact). 10yr Treasuries, on the other hand, last 10 years. The average 30yr fixed mortgage lasts between 5 and 10 years depending on the market conditions. Investors place different premiums on rates with different terms. Simply put, the Fed Funds Rate is indeed still at rock bottom, but longer-term rates are not.

This isn't anything new or different, for what it's worth. The Fed Funds Rate has always ebbed and flowed in relation to longer term rates.
"But wait... I heard that mortgage rates are still really low and that they only went up a tiny amount this week!"
Well, that depends on your perspective. Is 3.125% still really low for the average 30yr fixed mortgage rate? Yes! That was the all-time low before covid. But is it much higher relative to the past few weeks and months? Here too, it depends on your perspective, so let's leave it at this: rates rose more this week than on any other week in the past 11 months.
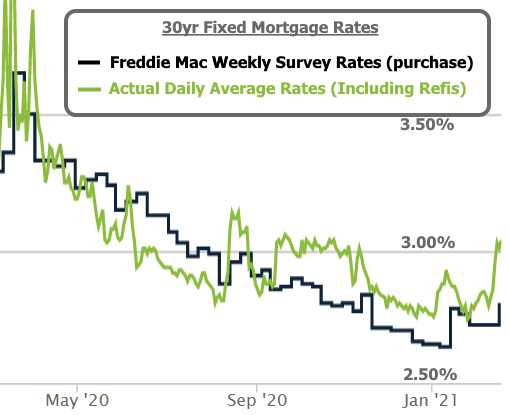
If you've heard that rates only rose slightly, it may have to do with headlines quoting Freddie Mac's weekly survey. While that survey is accurate over time, it doesn't capture short-term volatility. It also tends to stop measuring most of any given week's volatility on Monday, and Monday was a holiday! As such, it's lagging the reality on the street.
On the economic data front, Retail Sales (this week's biggest report) rose at the 4th fastest pace since records began in the early 90s. In general, stronger economic data puts upward pressure on rates.

In terms of housing-specific data, this week brought an update on residential construction numbers. They're still stellar.

Whereas Housing Starts are subject to weather-related delays and other potential roadblocks, building permits are a bit more free-flowing, and they just set another long-term high.

