After spiking in early January, interest rates returned to near-all-time-low levels by the middle of the week. By the end, however, the market began to flash a warning about more volatility ahead.
The warning is fairly simple. It has to do with a pattern that's been repeating in the bond market (the key ingredient in determining rates). The pattern is technically referred to as a "trend channel," which is just a fancy way of saying that rates are steadily rising or falling in a relatively regular way. In the current case, they've been rising since August.
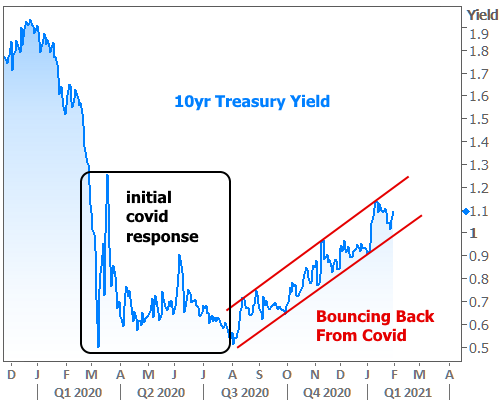
Rates tend to fall when the economic outlook is downbeat or uncertain. As such, it makes sense to see volatility and all-time lows during the first phase of the pandemic followed by gradual healing in the 2nd half of the year. Gradual healing = gradually higher rates.
If you mainly follow mortgage rates instead of the broader bond market, you may be thinking "but rates haven't been gradually higher!" and you'd be right. That's because mortgage rates cut a very different path for most of 2020. Here's the same chart with mortgage rates added on the left axis:
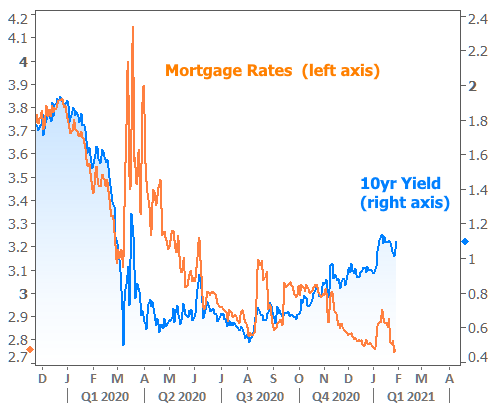
Keep in mind that this chart will look different depending on the time frame selected. For instance, if we zoom out a bit more and adjust the scaling, we get the impression that mortgage rates were not able to fall as much as Treasury yields at the start of the pandemic, but the two are now more-or-less reconnected.
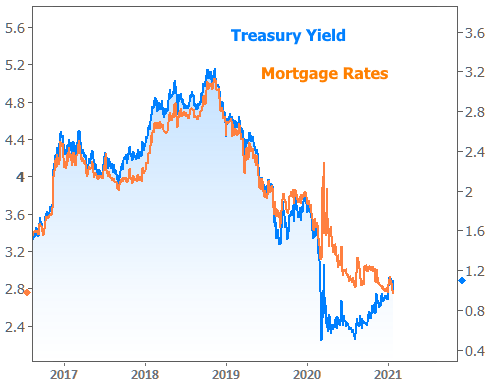
Indeed, that's the right way to view it. Why? Because there's an established range between Treasury yields and mortgage rates, and we're right back in the middle of it.

The implication is that mortgage rates will now be less capable of defying the will of the broader bond market. In other words, if Treasury yields keep rising, mortgage rates are more likely to follow than they were during the 2nd half of 2020.
One could rightfully argue that Treasury yields are far from the only consideration for mortgage rates (obviously, based on 2 of the charts above). But even when we look at the mortgage-backed-bonds that are directly responsible for mortgage rates, we're seeing a similar return to normalcy. Granted, it's not the "old normal" that existed before covid, but for the time being, there is a "new normal" that requires lenders to set rates a bit higher relative to the bond market than they have historically.

If you're not exactly sure what you're looking at, here's some more background: mortgage-backed bonds set a baseline for the rates lenders can offer. But lenders have an additional margin that covers things like their profitability, servicing costs, regulatory fees, and any other "cushion" to insure against uncertain market conditions.
Covid caused many of these additional costs to spike, thus making mortgage rates MUCH higher than past precedent suggested they should be. The chart above shows that precedent as well as the "covid effect."
The blue line represents lenders' cushion, and although it's not yet back to the normal range, that normal range is probably higher than it used to be. So the fact that we've seen bounces at the same place 2 times now suggests the cushion is getting thin.
Bottom line: it's harder and harder for mortgage rates to avoid taking part in broader bond market volatility. So when we see Treasury yields bounce to remain in a rising trend as they did this week, we should be more concerned about mortgage rates following suit than we were conditioned to be in 2020.
Housing Data Recap
There were several housing related reports released this week. here's a quick run-down followed by charts:
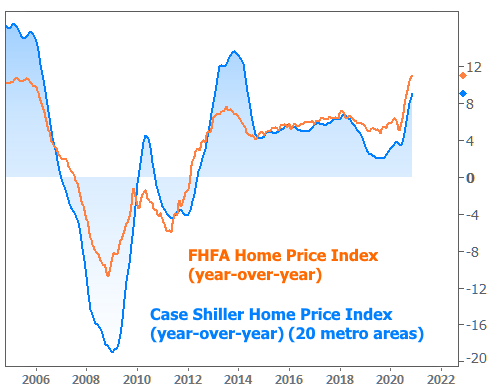
- Home price data was stellar on Tuesday with both Case Shiller and FHFA reporting another big increase for the month of November.
- New Home Sales were roughly unchanged for December after pulling back from long-term highs in September. Apart from the past 5 months, December would have been a 15-year high.
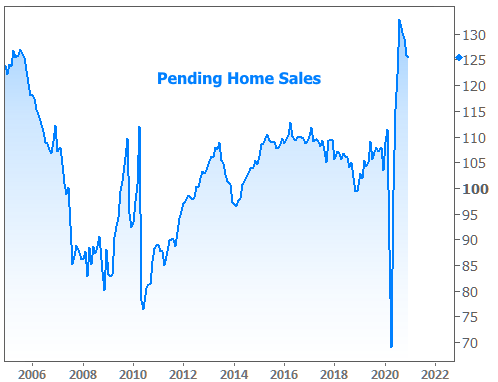
- Pending Home Sales were also roughly unchanged for December. They too remain close to the long-term highs seen in September.