
In the natural world and financial markets alike, September is a month of transition. This particular September holds some risks for the recently strong performance in mortgage rates. Meanwhile home sales numbers are increasingly sluggish. Both are threats that should be taken seriously, but it's too soon to be overly concerned.
When it comes to housing metrics, it's hard to adjust one's level of concern from week to week considering key reports come out once per month. It really takes 3-4 months at a minimum to even begin talking about a shift toward slower sales.
That said, if stagnation is the sort of thing that concerns you, buckle up. We don't need 3-4 months to observe stagnation because it's already here--at least in terms of Pending Home Sales. That's not NEW news, but this week's report added to 2+ years of evidence.
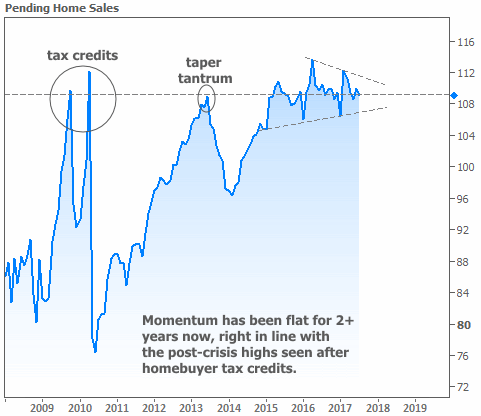
Pending Home Sales data is expressed in the form of an index. It differs slightly from final sales figures, but it's highly correlated, not to mention more timely. Think of it as a sneak peak at home sales momentum over the next 2 months.
With the index persistently running into the same ceiling throughout the recovery, it's fair to wonder if we're witnessing some sort of new normal. In other words, when the Pending Homes Index is around 110, is that about as good as housing gets anymore?
As you're likely tired of hearing, the answer to that question will be a function of INVENTORY. If you know someone who has shopped for a home recently, chances are they're not complaining about an overabundance of great options that meet their needs and budget.
Don't assume that inventory issues exist in a vacuum though. They're part of an ecosystem that involves the broader economy. By the time we consider that there's some level of "intangible real estate shellshock" left over from the financial crisis, we can appreciate that there's no single solution to the inventory problem. Ultimately it will take a bunch of smaller solutions that promote confidence and mobility. That will take time.
Mortgage rates have certainly been doing their part to grease the skids for prospective homebuyers. Rates hit the best levels of the year yet again this week. The catalyst was the news of a North Korean missile being spotted over Japan on Monday evening. The reaction on Tuesday morning was crystal clear (sharply lower rates and stock prices), but markets quickly began calming down (i.e. "moving higher")--especially stocks.
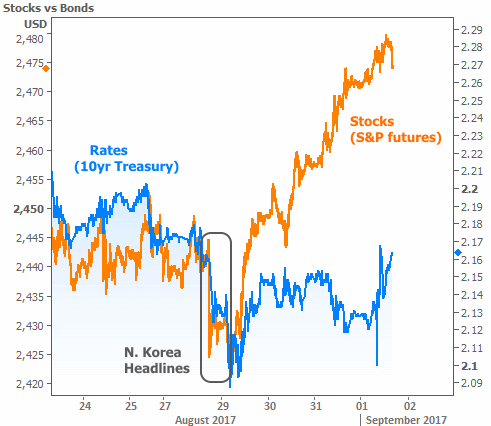
As seen in the chart, rates remained reasonably calm until the end of the week. Interestingly enough, the move toward higher rates on Friday followed a rather weak Employment Situation (the big jobs report that historically influences rates more than any other economic report). Weak jobs data would normally help rates move lower, so what gives?!
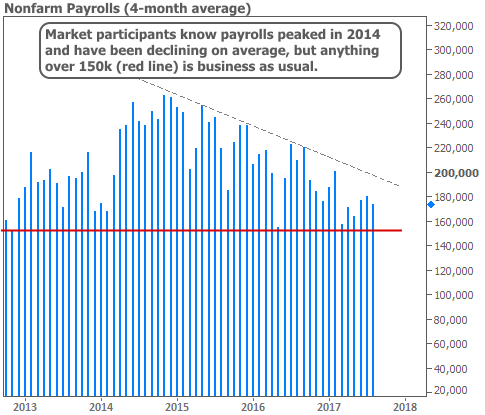
Simply put, payroll counts aren't very interesting these days. The post-crisis expansion has seen an impressively long streak of above-average job growth (less impressive in light of the job destruction during the Great Recession, but I digress). Payroll numbers have room to move around in their current range without sending any major warnings about the economy.
After topping out in 2014, payrolls have been gradually consolidating with the lower readings right around the level seen in this week's report. We'd need to see that number fall outside these converging lines before market participants would get too worked up about it.
Inflation is another story. We know an absence of inflation is preventing the Fed from aggressively removing accommodation (i.e. hiking rates and decreasing its bond holdings) and that's a key reason that rates have been able to stay relatively low in 2017.
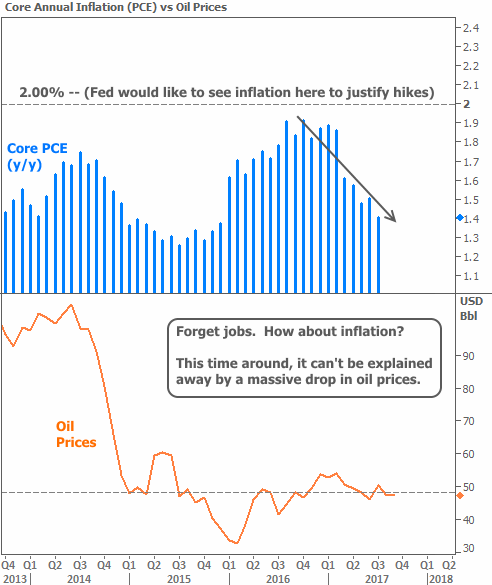
To whatever extent inflation continues inexplicably moving toward recent lows, it's hard to be too terribly concerned about a massive bounce in rates. But traders are perfectly happy to be concerned about smaller bounces in rates. Such concerns played a role in this week's bounce.
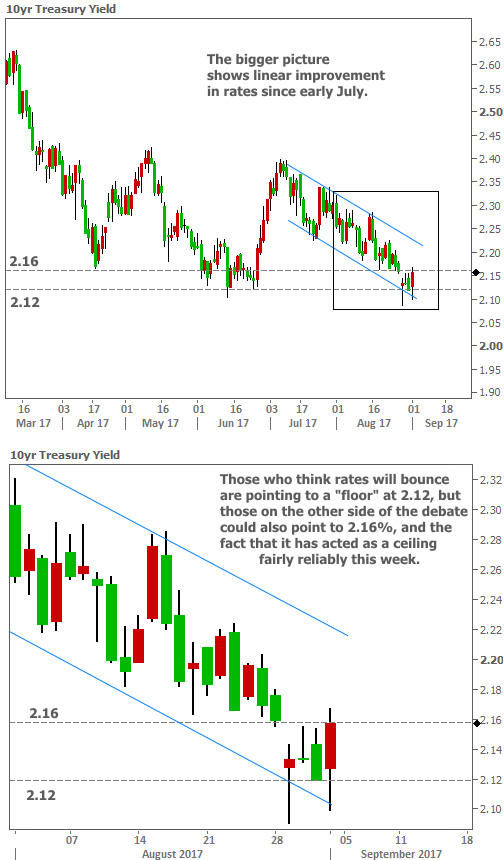
Simply put, the trend of improvement in rates has been stable for long enough that some traders figure it's time for a bit of a correction. The "lows of the year" seem like as good a place as any for that bounce to occur. But it's not a one-sided argument. More than a few traders continue to believe the rate rally can continue. They showed their support by buying bonds this week whenever yields rose to the 2.16% technical level highlighted in last week's newsletter.
Apart from being light on economic data, next week is shortened by the Labor Day holiday. With Congress returning to work on the debt ceiling and the European Central Bank potentially ready to comment on its bond buying program on Thursday, we're looking at a few big, isolated events against a backdrop of otherwise calm and inconsequential trading. This is a recipe for volatility, but not a guarantee. We're looking at the end of September (following the Fed Announcement on the 20th) before the bigger moves become possible.
