
The relationship between "Fed rate hikes" and mortgage rates can be confusing at first glance. After all, mortgage rates moved lower in the days and weeks following the past 3 Fed rate hikes. While they aren't necessarily repeating the same pattern this time around, mortgage rates were nonetheless unfazed by this week's Fed hike.
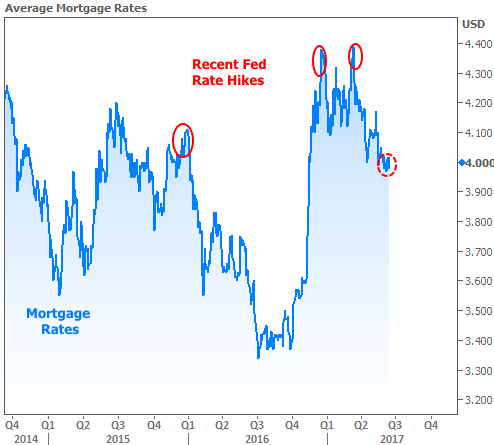
This dichotomy exists for 2 main reasons. The first is more objective and basic. It has to do with the structure of the bond market and the way the Fed hikes rates. Almost everything in the bond market (including mortgage rates) is free to move every day while the Fed Funds Rate can only move 8 times per year at scheduled meetings. This means mortgage rates can adjust for expected changes in the Fed Funds Rate ahead of time. That's why you see mortgage rates topping out heading into the last 3 Fed rate hikes. They were bracing for the expected impact.
The second and more important reason is "duration" (how long a particular fixed-income investment will last). Fixed-income refers to securities that allow investors to pay upfront for the right to receive principal and interest payments on a "fixed" schedule. Although mortgage rates and the Fed Funds Rate are both part of the fixed-income market, they keep two very different schedules, and that's a big deal for investors.
Just imagine you're a bank who makes 2 loans today: one that will be paid back in full tomorrow and one that will last roughly 7 years. You're probably not going to offer the same terms on these 2 loans! Multiply that concept by the trillions of dollars circulating in the bond market--ranging in duration from "overnight" to "decades" and you can quickly appreciate why short-term rates don't move in tandem with longer-term rates.
Simply put, long-term and short-term rates care about different things. Short-term investors (think under 2 years) will be in and out of the market well before several longer-term risks might be realized. Long-term rates, on the other hand, must consider what inflation, growth, and Fed policy might look like many years in the future! This is precisely why longer-term rates have been able to move lower recently as the outlook for inflation, economic growth, and Fed rate hikes has cooled relative to previous expectations
That last part ("relative to previous expectations") is important. It means investors don't necessarily see inflation, economic output, or the Fed Funds Rate falling outright, but rather, simply not living up to previous expectations. One great way to observe this phenomenon is to look at the relative change in Fed rate hike expectations for this September and next September versus the 10yr Treasury yield (a ubiquitous benchmark for long-term rates). The following chart shows that markets have increasingly come to terms with the 2017 rate hike outlook, but now think the Fed will be much slower to hike in 2018. Unsurprisingly, longer-term rates line up better with the longer-term rate hike outlook.
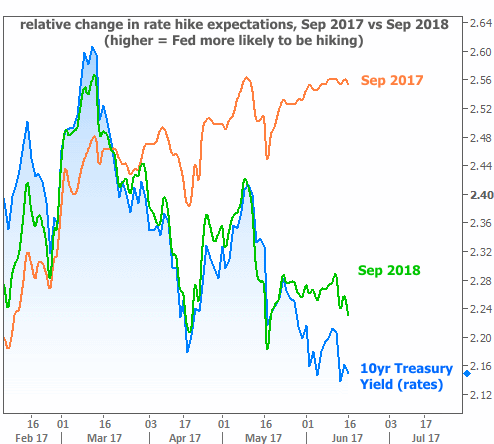
Another tacit implication of the chart above is that markets were well-aware that we'd see a Fed rate hike this week. As such, the hike itself was of little consequence. In fact, most of this week's downward movement in rates happened on Wednesday morning when key reports on inflation and retail sales fell well short of expectations. Traders figure the Fed will have a hard time sticking to its current rate hike trajectory if inflation and growth continue cooling. That's the nice way of putting it.
Some traders might say the Fed either has their collective head in the sand regarding the absence of convincing inflation. Others might say the Fed just isn't fully broadcasting its motivation for removing accommodation (i.e. raising rates and decreasing balance sheet reinvestments by the end of the year).
This quasi-conspiracy theory holds that the Fed wants to get ahead of the next economic downturn with rates high enough to cut, and a balance sheet small enough to expand. In the Fed's defense, they've fully admitted to this line of thinking, but have stopped short of including it in official policy verbiage (likely because it would do more harm than good to list "getting ready for an impending recession" as a driving force behind policy changes).
This latent belief that the Fed is a bit too optimistic (regardless of the reason) is consistent with interest rates' ability to hold their ground despite the fact that stocks continue to operate near record levels.

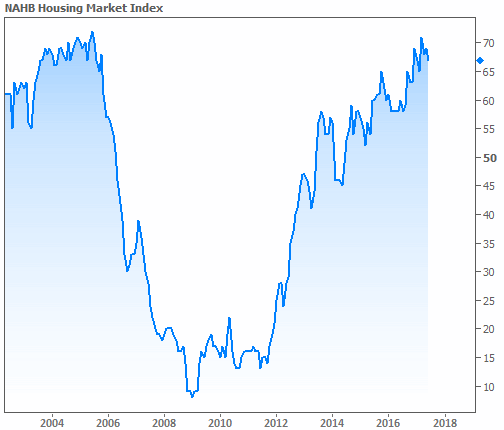
In housing-specific news, this week's economic data was generally downbeat. The National Association of Home Builders reported a drop in its Housing Market Index (a measure of builder confidence). In context, however, the index doesn't look like it's in trouble just yet.
It's harder to offer a compelling counterpoint for Friday's New Residential Construction data from the Census Bureau. Both Housing Starts and Builder Permits came in well below forecasts, prompting National Association of Realtors' Chief Economist to say "housing shortages look to intensify and may well turn into a housing emergency if the discrepancy between housing demand and housing supply widens further."
